














Dashboards and Analytics | GO MVP Agency
GO MVP Agency GO MVP Network GO MVP Labs
Agency
Services+ All Services Internal Communications External Communications Business Development Zoho Implementation Process Automation Dashboards & Analytics Accounting Support Teams & Fractional Roles Training & Certifications Branding Marketing & Advertising Content Creation Web Development & Ecommerce Instore Marketing Social Engagement Custom Strategies Corporate Communication Planner Pipeline & Sales Tools Omnichannel & Email Marketing Technology Assessment Business Development Tools
Solutions+ All Solutions CRM Project Management Customer Service & Support Booking & Scheduling Remote Operations In-house Support Fractional Roles Pipeline Management Sales Tools Email Marketing Management Social Management Ecommerce Support AI Solutions Application Builder Custom Operating Systems Performance Monitoring Advanced Analytics UX / UI
Zoho Solutions+ Zoho Solutions (overview) Zoho One Implementation Zoho CRM Zoho Desk Zoho SalesIQ Zoho PageSense Zoho Campaigns Zoho Books Zoho Billing Zoho Contracts Zoho Creator Apps Zoho Recruit Zoho People Zoho Marketing Automations Zoho Backstage Zoho AI Solutions
Case Studies Service Planner
About Us+ About Us Our Model Team Partner Profiles Better World Initiatives News & Insights
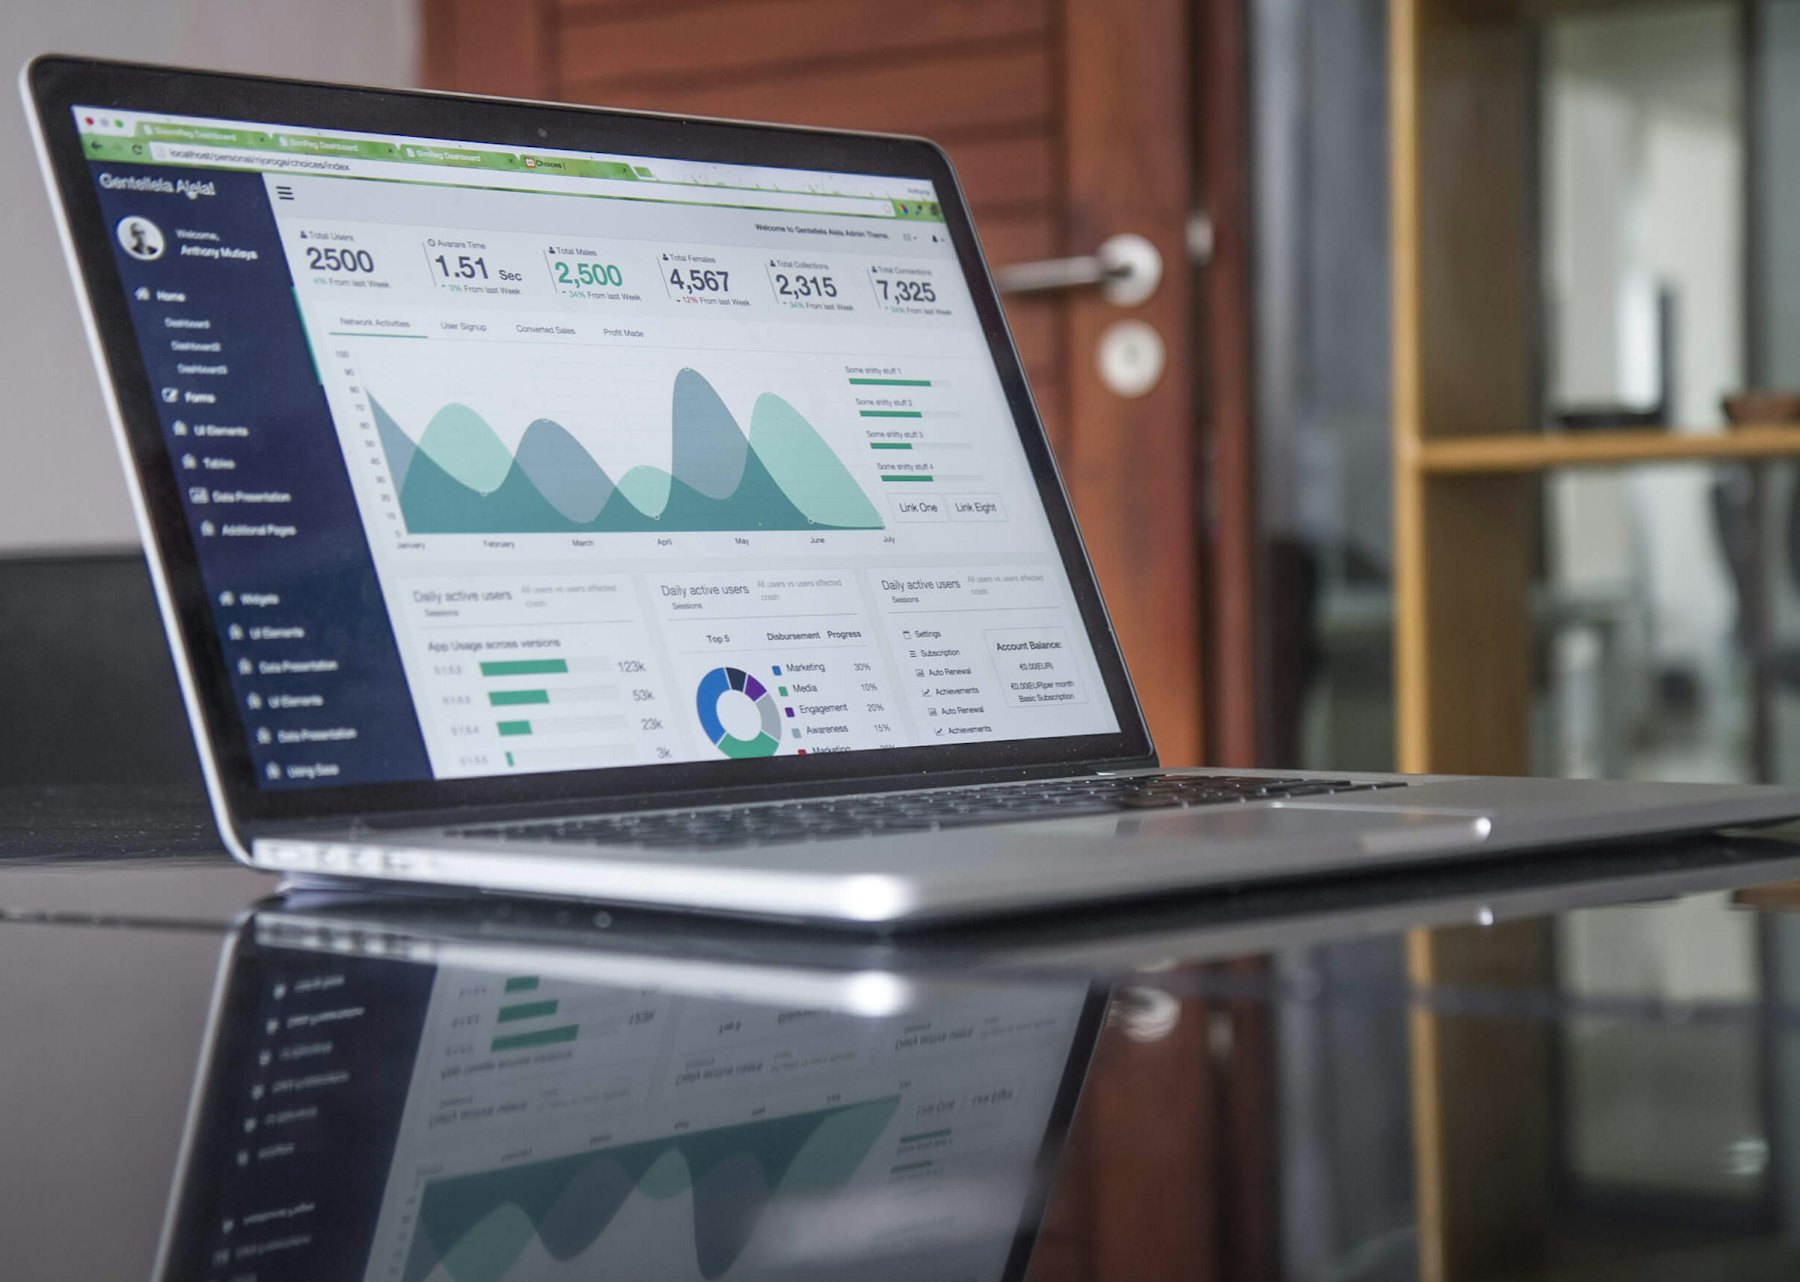
Laptop showing analytics charts and performance data
Internal Communications / Dashboards & Analytics

Full vision of your business, from the boardroom to every desk.

We build dashboards and analytics on any technology, customized for your company, each department and every person, so everyone sees the numbers they own and the plan they are working toward.

See My Business Clearly → Plan Your Journey
Full vision, to a granular scale

One source of truth. Four levels of focus.

The same data serves the whole company. Leadership sees the full picture, each department sees what it controls, and every person sees their own numbers. Choose a level to zoom in.

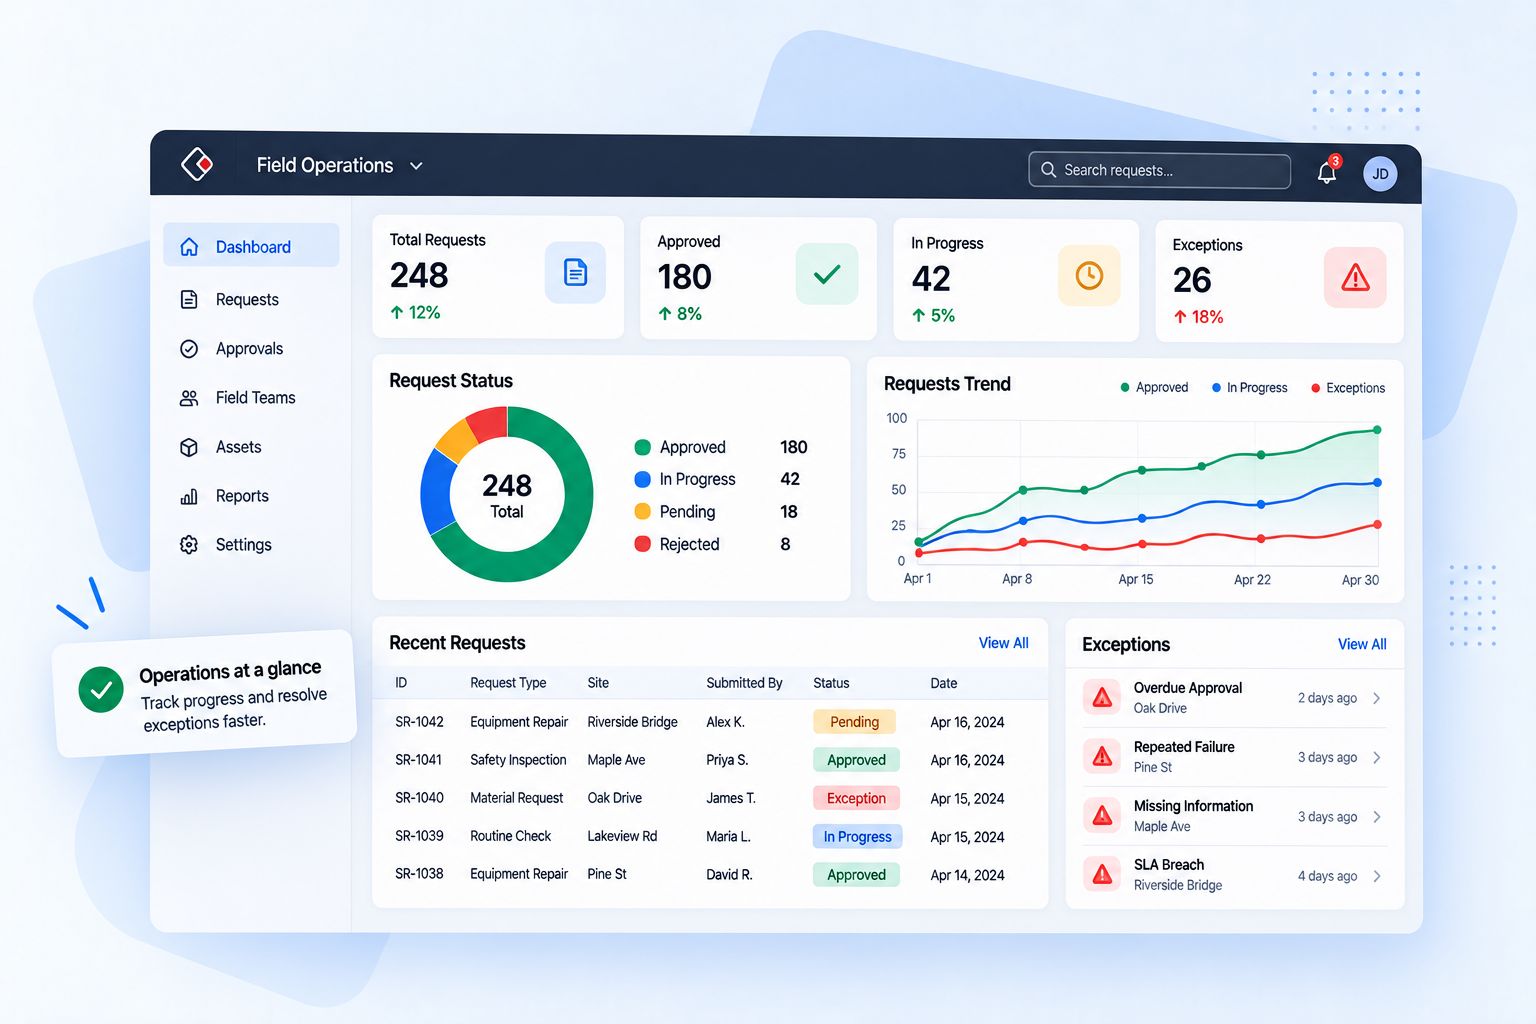
The whole business on one screen

Owners and leadership see revenue, margin, cash, pipeline and growth together, against the plan.

Who sees it: Owners, CEO, board

Same data, filtered to this level.

KPIs at this level

TrendRevenue vs. plan
WeeklyGross margin
ProgressCash position
Vs. targetPipeline value
MixCustomer growth
Plan vs. actualChurn and retention
HealthHeadcount
SignalsForecast to year end
Every technology

Your data, wherever it lives. Your dashboards, wherever you work.

We work with the tools you already have or recommend the right ones. Zoho Analytics is our core platform, and we build on other BI tools and custom dashboards when they fit better.

Start with a Technology Assessment

We connect

Any CRMERP and accountingAd platformsSocial networksEcommerce and paymentsSpreadsheetsSQL and cloud databasesAPIs and custom apps
Customized for every department

Every area measured on what drives its results.

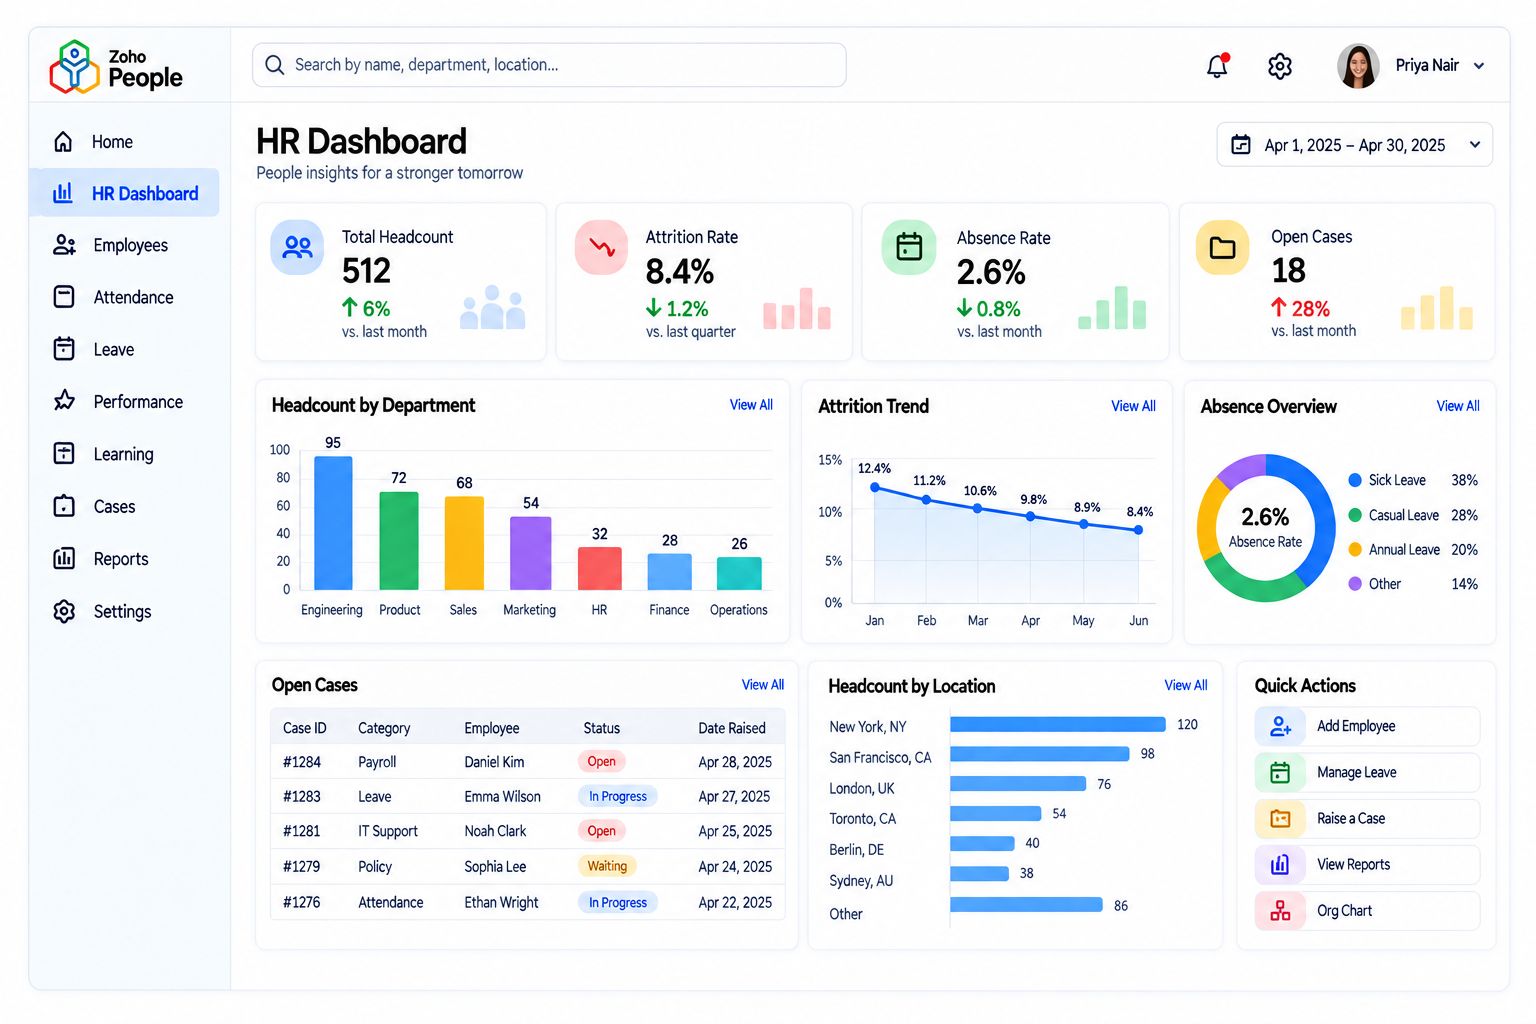
Each dashboard is designed with the people who use it. Choose an area.

Advanced Analytics →
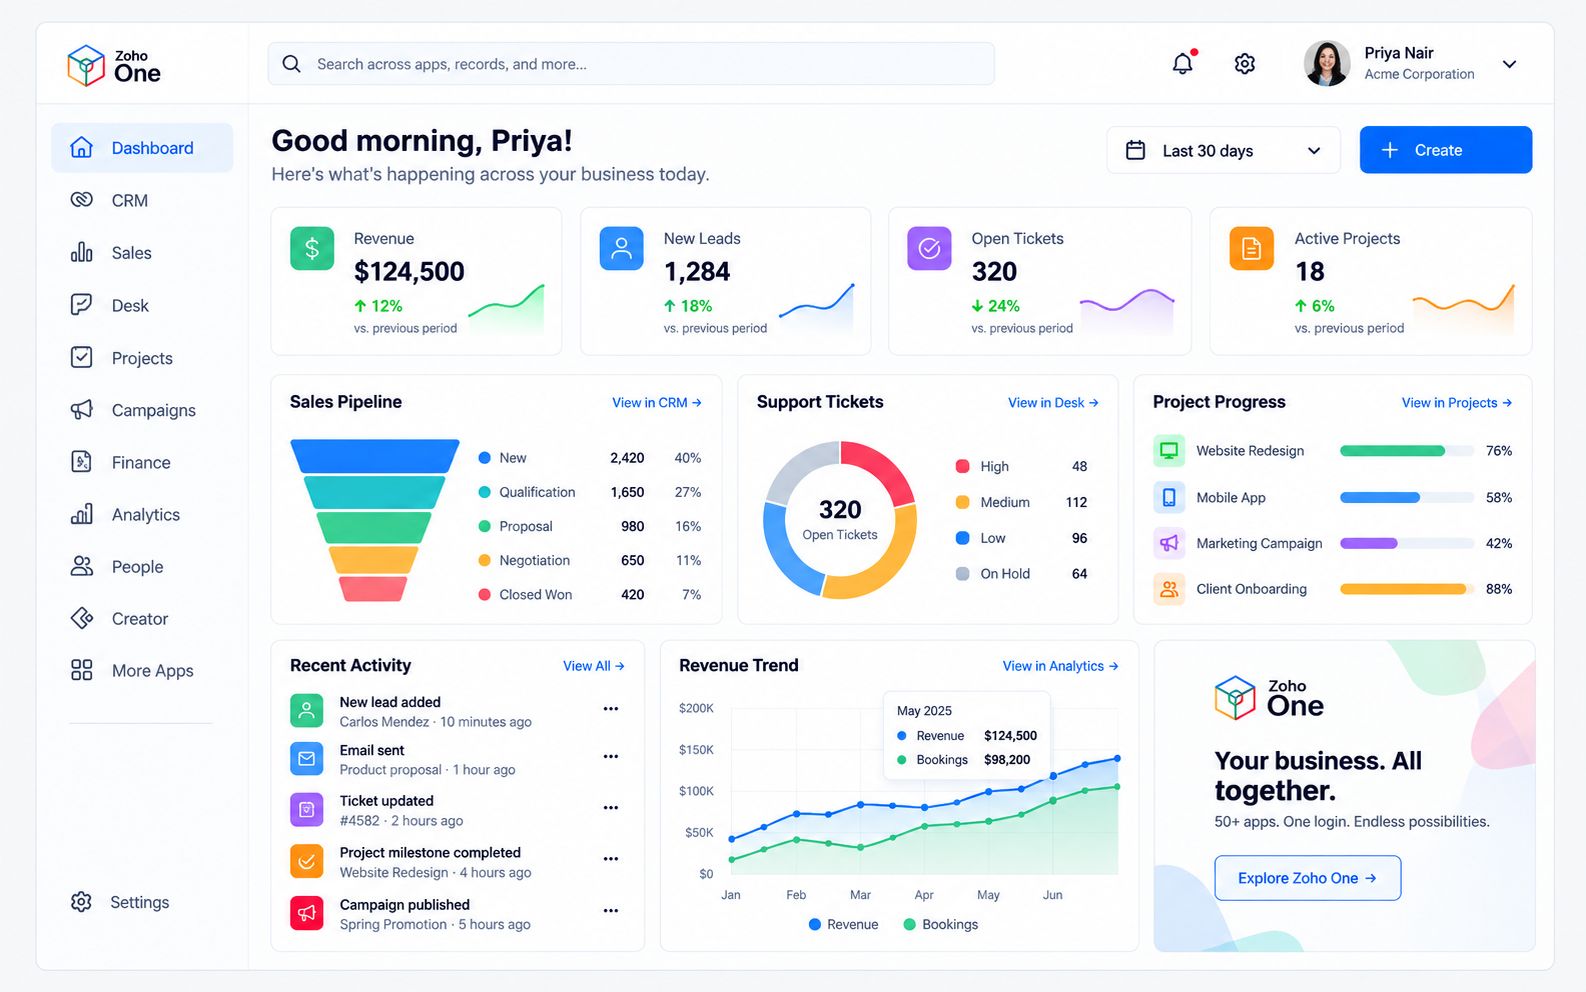
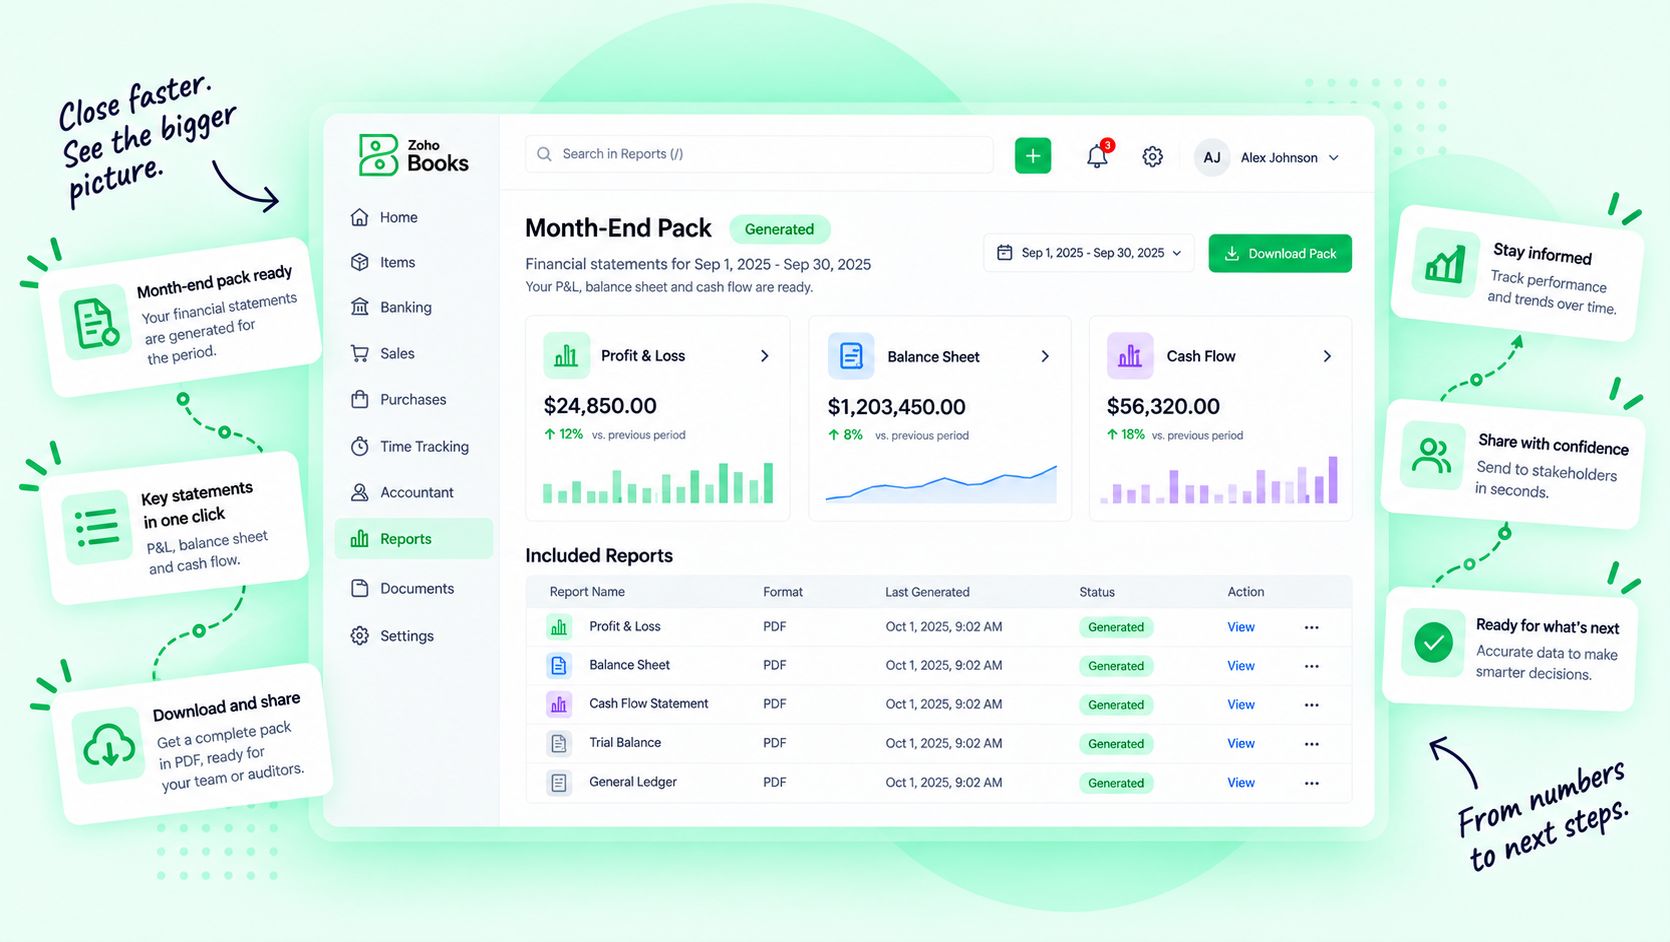
A blended Zoho One dashboard for leadership

Leadership

One view of the plan and how the business is tracking against it.

What you see

  • Revenue, margin and cash vs. plan
  • Pipeline and forecast to year end
  • Department scorecards side by side
  • Board and investor report packs

Data from

Zoho AnalyticsZoho OneZoho BooksZoho CRM
AI insight

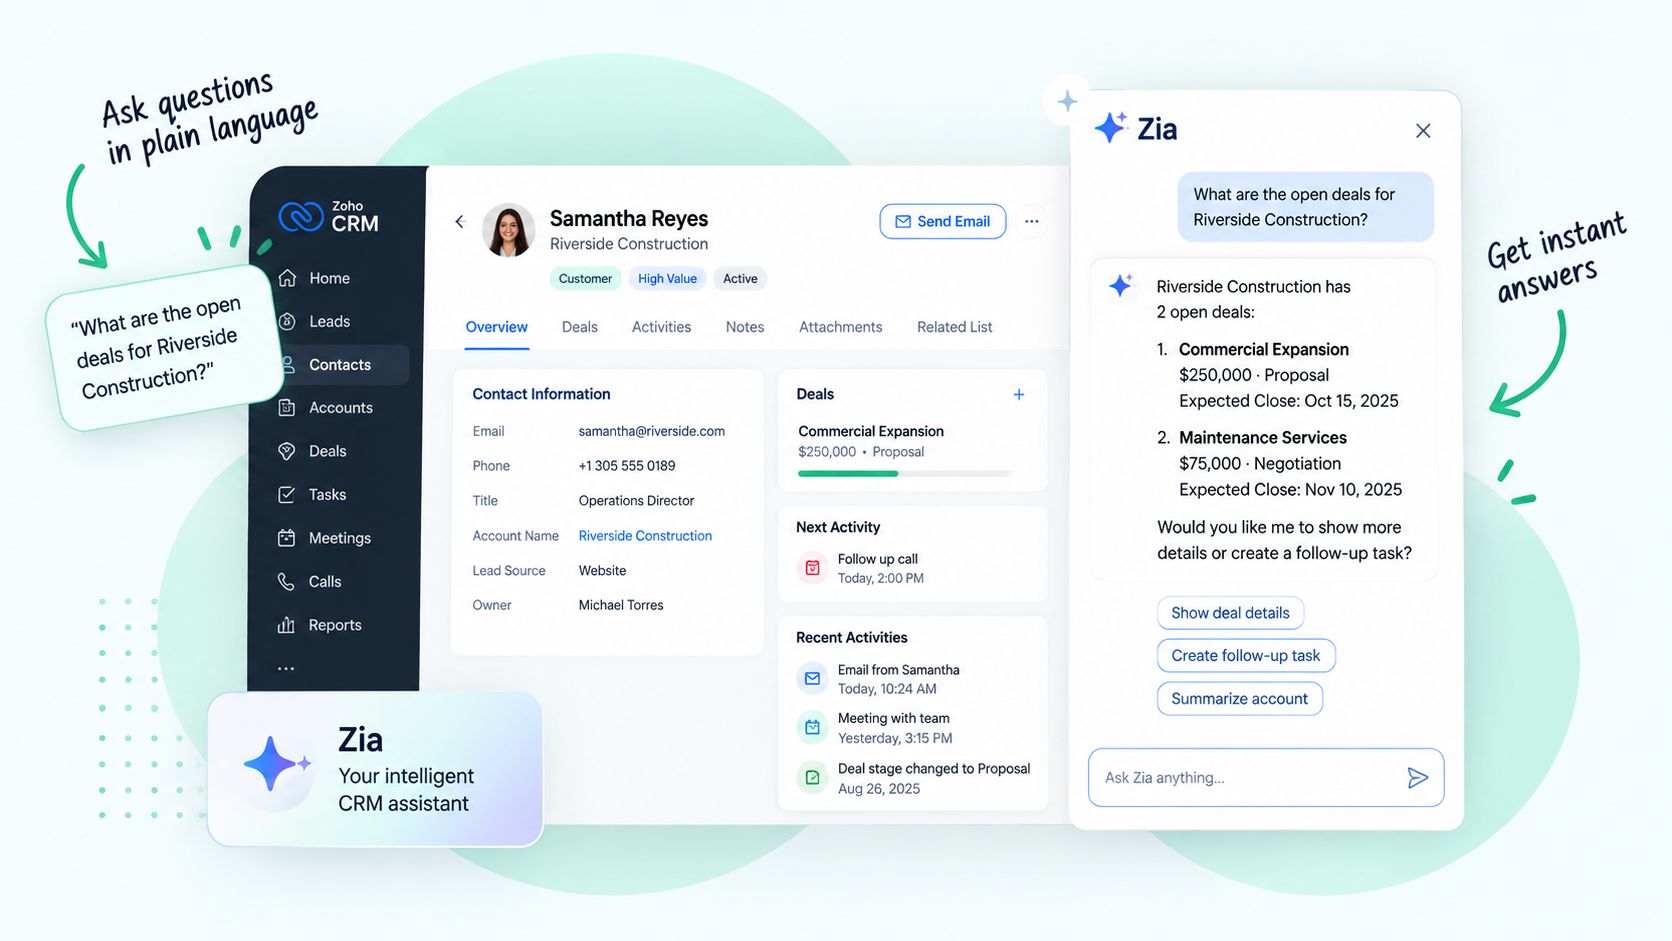
Zia writes a weekly summary of what moved and why.

From seeing to planning

Set the plan, track it live, adjust before it’s late.

Dashboards are only half the job. We connect your goals, budgets and forecasts to the same data, so every number is read against where you meant to be.

Goals and OKRs

Company goals broken down by department, team and person, tracked live.

Budgets vs. actuals

Every department’s spend and revenue against its budget, by month.

Forecasts

Revenue, cash and demand projected from your real data, updated as it changes.

Scenario planning

See what happens to the plan if prices, hiring or conversion rates change.

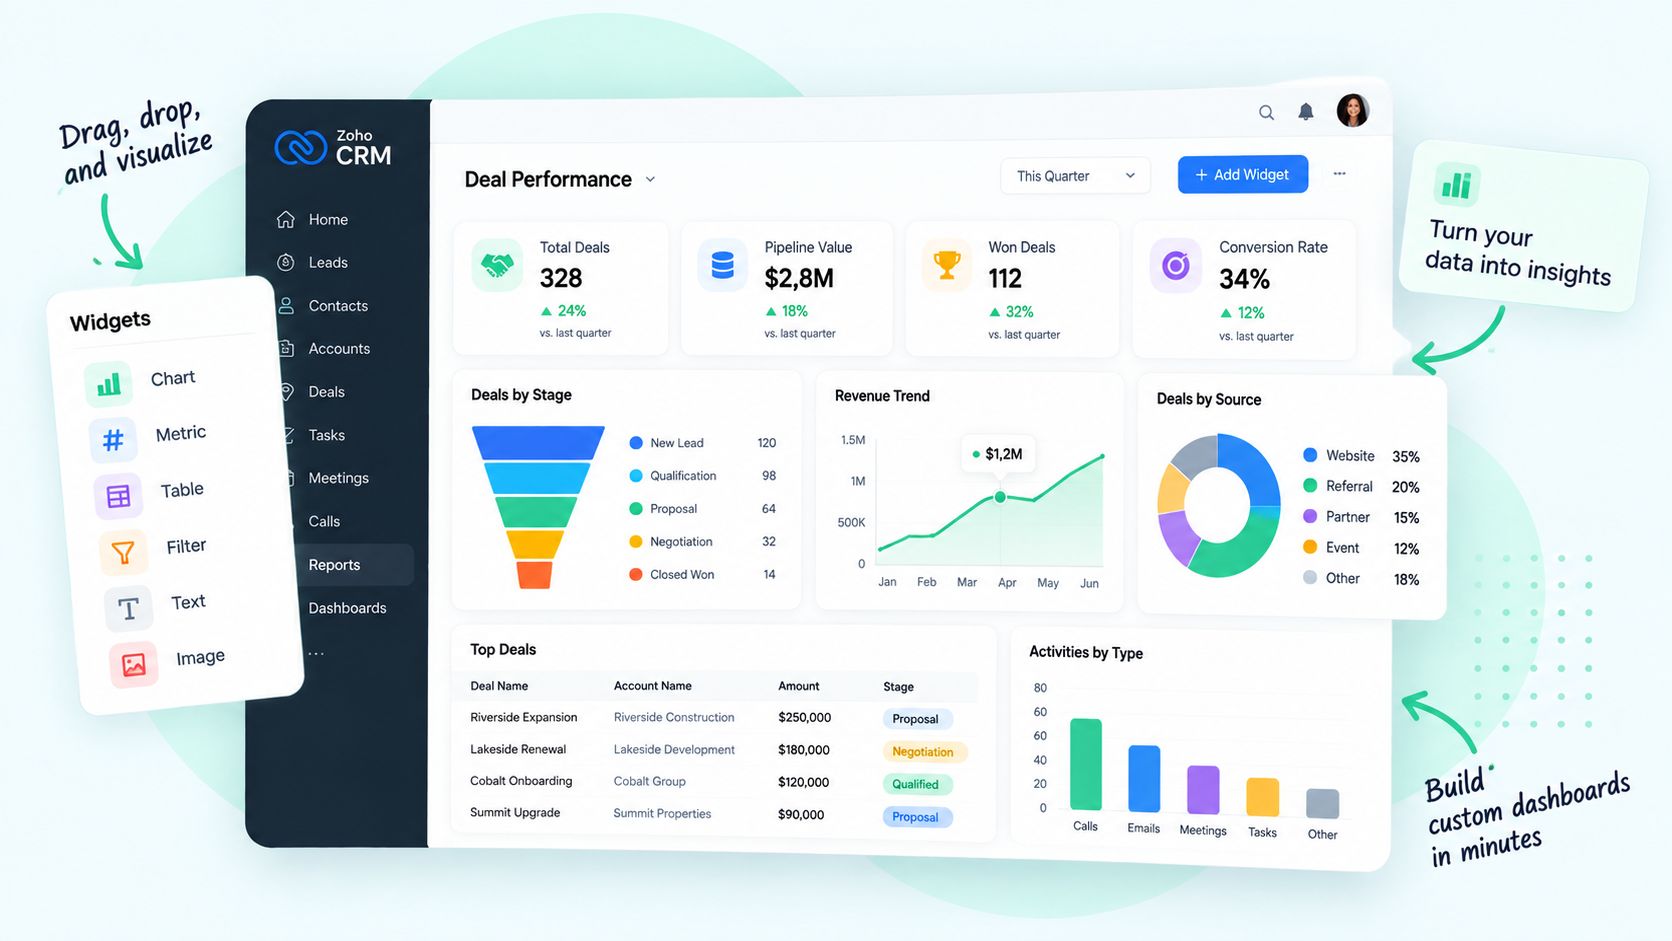
Zia AI insights inside Zoho CRM
AI in your analytics

Ask a question. Get the answer, and the reason.

Zia and our AI agents sit on top of your data. They answer in plain language, watch for changes and tell you what needs attention. Your team decides what to do about it.

  • Plain-language questions: “Which region missed target last month?”
  • Alerts when a KPI moves outside its normal range
  • Forecasts for revenue, cash, demand and churn
  • Written summaries of what changed and why
Explore AI Solutions → Zia Agents
Connected to business development

The numbers behind every growth decision.

Dashboards measure the work of every other module, and every module feeds the dashboards.

All Business Development
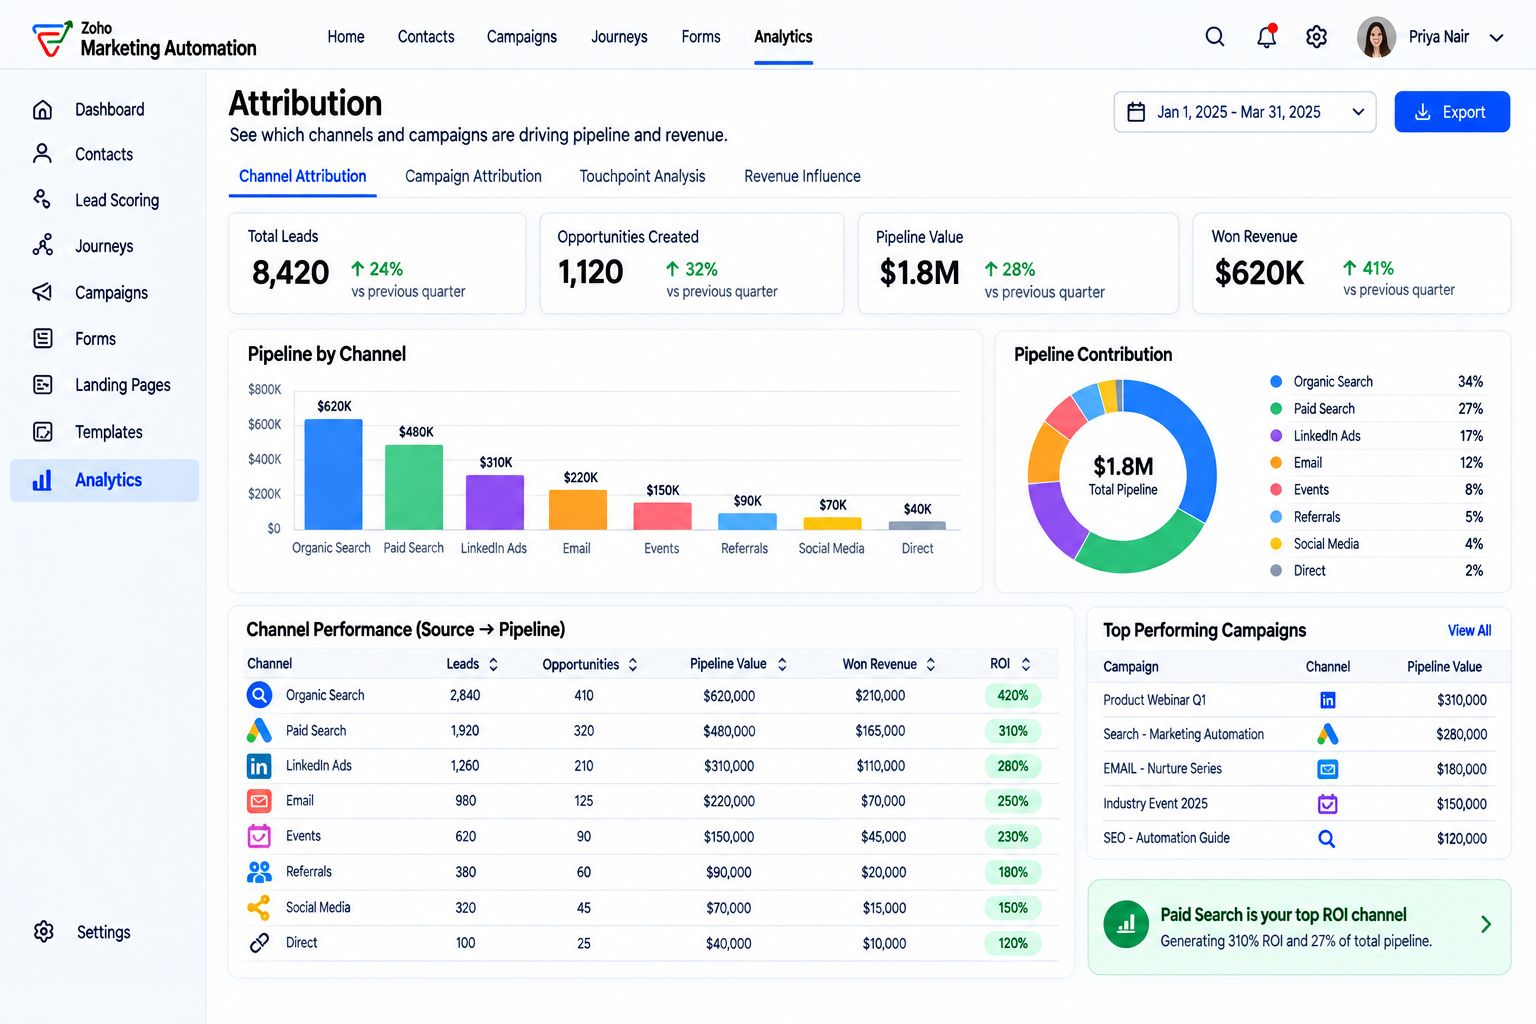
Pipeline Management Pipeline health, stage conversion and forecast accuracy. Explore → CRM The customer data behind every sales and service KPI. Explore → Sales Tools Activity and productivity metrics for every rep. Explore → Business Development Tools Prospecting, partnerships and expansion tracked in one view. Explore → Custom Strategies Strategy goals turned into measurable targets. Explore → Process Automation Workflow cycle times, volumes and errors measured. Explore → Advanced Analytics Predictive models, data science and deeper analysis. Explore → Performance Monitoring Alerts and reviews that keep the numbers on track. Explore →
How we build it

From scattered reports to full vision in five steps.

01

Define the KPIs

We agree with leadership and each department on what to measure and why.

02

Connect the data

Every source joined, cleaned and refreshed automatically.

03

Design the views

Dashboards built with the people who use them, for each level.

04

Roll out by role

Access set per person, with training on reading and acting on the numbers.

05

Review and refine

Monthly reviews to add, retire and improve KPIs as the business changes.

Still building reports by hand every month? Let’s fix that.

Book a KPI workshop → Performance Monitoring
FAQ

Questions we hear first.

Something else on your mind? Ask us on a call.

Do we have to use Zoho Analytics?+

No. Zoho Analytics is our core platform, but we also build on Power BI, Tableau, Looker Studio and custom web dashboards. We recommend what fits your data, team and budget.

Can you connect data from systems outside Zoho?+

Yes. We connect other CRMs, accounting and ERP systems, ad platforms, ecommerce, spreadsheets, databases and custom apps.

How granular can the dashboards get?+

Down to the individual. The same data is filtered by company, department, team and person, so everyone sees the numbers they own.

Who can see what?+

Access is set by role. Leadership sees everything, managers see their teams, and each person sees their own numbers, unless you decide otherwise.

How current is the data?+

As current as the source allows. Most connections refresh automatically, from every few minutes to daily.

How does AI help with analytics?+

Zia and our AI agents answer questions in plain language, flag unusual changes, forecast trends and write summaries. Your team decides what to do with them.

Can we track goals and budgets, not just results?+

Yes. We connect goals, budgets and forecasts to the same data, so every number is read against the plan.

How long does it take to launch?+

A first leadership dashboard can be live in a few weeks. Department and personal dashboards roll out after that, depending on the number of sources.

Let’s talk

Tell us the decisions you need to make. We’ll build the view that makes them clear.

Bring your KPIs, your reports and your goals. We’ll show you what full vision looks like for your company.

Schedule a Demo → Plan Your Journey
Contact us →
GO MVP

Corporate Communications. Emotional Storytelling. AI. Operating Systems.

Services

Solutions

Zoho

Company